BACK TO RESEARCH WITH IMPACT: FNR HIGHLIGHTS
Feedback from applicants and reviewers (2021–2023) and what we’re researching next
Since 2021, the FNR has used narrative CVs as part of a broader move toward more qualitative and responsible research assessment. Three years on, a growing body of feedback and data allows us to take stock of how this change is working in practice. This article brings together survey results from applicants and reviewers (2021–2023) and outlines ongoing research analysing submitted narrative CVs to better understand how they are used.
Why narrative CVs?
Research assessment is increasingly moving away from narrow bibliometric indicators (like citations and impact factors) towards more qualitative evaluation, driven by initiatives such as CoARA and DORA and widely supported across European universities and funders. A key tool in this shift is the narrative CV (NCV), which lets researchers describe a broader range of contributions across research, teaching, service, and societal impact, in a structured narrative rather than just listing publications.
Across Europe and beyond, research assessment is therefore shifting: funders and institutions want to recognize contributions that are hard to capture with publication lists alone (e.g., mentoring, service, open science, and societal engagement). Narrative CVs are one response to this reform agenda. At the FNR, the narrative format was introduced in 2021 to broaden the picture of a researcher’s profile and to complement other information used in evaluation, allowing scientists to present who they are professionally by choosing what achievements to emphasize. Even though the NCV is widely adopted, little is known about i) how applicants perceive it; ii) how reviewers perceive it; and iii) what it actually does to funding decisions.
To address points i) and ii), FNR did systematic surveys after calls to understand how the concerned parties felt about the new CV format. To shed light on iii), a team of researchers* is currently looking into 1211 NCVs submitted as part of a grant application at the FNR between 2021 and 2025, covering 965 applications and 745 unique authors.
How we monitor implementation
To understand how the change works in practice, FNR has run yearly feedback surveys with applicants and reviewers. The figures below synthesize key patterns across the 2021–2023 survey waves.
Who responded?
The survey was sent to reviewers and applicants. For reviewers, response rates remained fairly stable (293 in 2021, 309 in 2022, 307 in 2023), with response rates around 48–53%. For applicants, response rates drop markedly after 2021, falling from roughly the mid-50% range (182 responses) to 31.7% in 2022 (148 responses) and 28.3% in 2023 (138 responses).
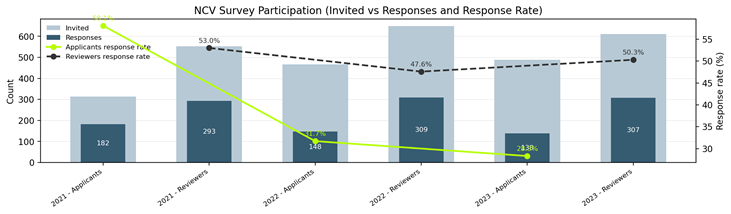
Notes: The figure shows NCV survey participation across three years, comparing the number invited (light bars) with the number of responses (dark bars) and the resulting response rate (green line for applicants; dashed line for reviewers).
Applicants: increasing acceptance, but time remains a pain point
Overall satisfaction among applicants increased from 2021 to 2023. While roughly 48% were positive, 33% were neutral and 19% were negative in 2021, this percentage changed to 63% positive, 30% neutral and 7% were negative in 2022 to 64% positive, 26% neutral and 10% negative in 2023. Applicants also consistently report that the narrative format helps them demonstrate a broader range of achievements, with a clear majority responding positively in each year (57% positive, 21% neutral and 22% negative in 2021; 61% positive, 23% neutral and 16% negative in 2022; 62.3% positive, 17.4% neutral and 20.3% negative in 2023).
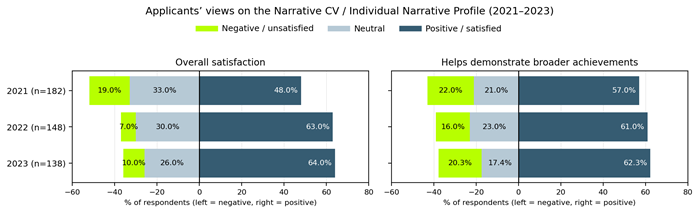
Notes: Bars show the percentage distribution of responses (negative–neutral–positive) for each year; sample sizes are shown next to each year.
At the same time, applicants consistently report that writing a narrative profile takes more time than compiling a traditional CV, especially when they are new to the format. Nearly three quarters indicated an increase in time (54.7% reporting >20% more time and 20.4% reporting 1–19% more), while 13.9 reported no difference. Only a small minority found it faster than a traditional CV (6.6% reporting 1–19% less and 4.4% reporting >20% less).
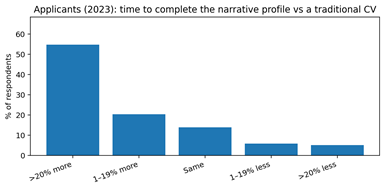
Notes: Applicants (2023): time to complete the narrative profile vs a traditional CV (N=137; excludes ‘N/A’ or non-respondents). Percentages are based on applicants responding to this question in 2023 (N=138).
Reviewers: broadly positive, with evolving practices
Reviewers report that the narrative profile is generally useful in evaluation and that it helps applicants demonstrate skills and experience beyond what a standard CV shows. Across 2021–2023, around two thirds to three quarters of reviewers consider the NCV useful for evaluation, with only a small minority reporting negative views. Reviewers also largely agree that the narrative profile helps applicants demonstrate skills and experience better than a standard CV, while negative responses remain limited, but higher when compared to the CV’s usefulness.
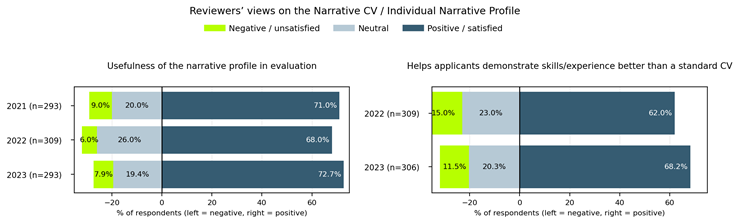
Notes: Bars show the percentage distribution of responses (negative–neutral–positive). Sample sizes are shown next to each year and exclude ‘N/A’ or non-respondents. In 2021, no comparable question to the other years was asked for skill demonstration in NCVs (right panel).
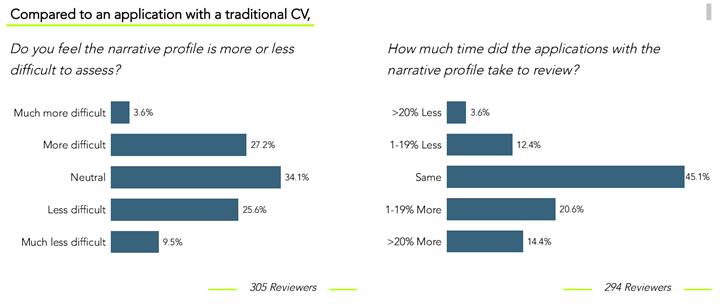
In 2023, reviewers generally reported that the narrative profile did not make assessment harder, but it often took more time. As shown by the graph below, reviewers differ in how much additional time the narrative format requires and in how difficult they find their assessment: the largest group reported that assessment was about the same (34.1%), and a about a third found it somewhat less difficult (35.1%), with the last thrid (30.8%) reporting that it was more difficult.
Despite overall positive feedback, most referees reported that verification was now part of their workflow. In 2023, about 70% reported consulting ORCID or other online resources to verify narrative claims. Most checks focus on publication records, education and career history.
Guidance and support: improving clarity, uneven support
While guidance has become clearer over time, reviewers often asked for more examples and clearer expectations on how to use the narrative profile in evaluation. On the applicant side, support from institutions or peers is uneven, raising fairness concerns if some researchers can access coaching while others cannot. While roughly a 20% of the respondents indicate having received a lot of support, roughly 54% have received little to no support according to the respondents of the 2023 survey. Online platforms such as PEP-CV should help make this difference smaller. While currently a platform for applicants’ guidance on how to draft an NCV, PEP-CV plans on extending it to reviewers as well.
What we are researching next (and why it matters)
To shed light on how the NCVs are actually used by applicants and whether or not they have an impact of funding decisions, a research team* looks into these questions. Concretely, using embedding-based NLP to code narrative topics and build Relative Topic Attention (RTA) indicators at the sentence level, a first goal is to understand how scientists use NCVs to construct professional identities and whether the choice of the CV content is affected by characteristics such as seniority, gender or discipline. They will then move on to measure whether those narratives ultimately influence grant funding outcomes by analyzing if narrative emphasis and identity strategies relate to evaluation outcomes, and whether effects differ by discipline, seniority, or gender.
Notes
Since 2021, the FNR has used narrative CVs as part of a broader move toward more qualitative and responsible research assessment. Three years on, a growing body of feedback and data allows us to take stock of how this change is working in practice. This article brings together survey results from applicants and reviewers (2021–2023) and outlines ongoing research analysing submitted narrative CVs to better understand how they are used—and whether they shape funding decisions.FNR Data Source: annual surveys done by FNR; more information here.
- Interpretation: Percentages may not sum to 100 due to rounding. Some questions exclude respondents selecting ‘N/A’. Survey findings reflect respondents’ experiences and perceptions; they do not by themselves prove causal impacts on funding decisions.
*The research team: The research team looking into NCVs is composed of Professor Cindy Lopes-Bento, Professor Stijn Kelchtermans and Luca Bollinger from the KU Leuven. Lopes-Bento is further a senior research scientist and the scientific lead of the Innovation and Science Observatory at LISER (Luxembourg Institute for Socio-Economic Research).
Related news
9.02.2023
Narrative CV – 2023 workshop
4.05.2022
2021 Narrative CV Workshop – slides available
15.02.2022
Narrative CV: Implementation and feedback results
Related highlights
How Early Funding Decisions Shape Research Careers
Since its creation, the FNR has been committed not only to funding excellent research, but also to understanding how funding…
Read more
Three routes to the PhD: A closer look at FNR’s doctoral funding landscape
In June this year, the University of Luxembourg welcomed a new generation of doctoral candidates at the 2025 Induction Days.…
Read more
Rising Competition in CORE: A decade of increasing demand, improved proposals and tougher choices
As the 10th April deadline for the 2025 CORE call approaches, we take a moment to reflect on the evolving…
Read more
Taking science to the next level: Towards open, inclusive, forward-looking research culture
As a funder, the FNR’s main job is to make sure the best science gets funded. How these decisions are…
Read more
Spotlight on Young Researchers: How is scientific quality fostered by research collaboration?
In the last decades, how research is conducted has been profoundly changed by ICT, and there has also been a…
Read more
The Science of Science: understanding what makes [excellent] science
The digital transition of society over the last decades has brought with it a wealth of data about research –…
Read more